
TIME TO STRATEGY EXECUTION: 76 DAYS
My suggestion to reframe the strategy as the creation of a new world fell flat with my team and the top leadership of STRIDE, much as it did with Sally. Maura has been privately supportive, but her position as head of the new Quality Assurance team doesn’t give her any latitude to oppose official policy.
Since the presentation about the end-state, I have been developing a list of issues and questions that I think should be addressed either in the strategy or with the public during its rollout. At the top of the list is the need for a straightforward explanation of why the population and consumption projections have changed radically since the reference strategy was released in January.
Sally offered to help me with that explanation after reassuring me that it wouldn’t slow her other work, and then began with what sounded like one of her rules. “The main thing to remember is that wants and needs are always in competition for resources. That applies to systems where resources are limited, and to systems where they appear unlimited; because speed of access will always be limited, and what is valued most can always change.”
“By ‘needs’ do you mean population?” I asked.
“In terms of resources, they are the same,” she confirmed. “If needs can’t be met then death will result; therefore, the amount of resources used for needs is proportional to the population.”
“So, there’s basically a tradeoff between people and what they consume beyond their basic needs, what protects them, makes them happy, and helps them have more kids who can survive long enough to take care of themselves.”
“Correct,” she said, “subject to individual preferences and capabilities, as well as constraints imposed by the environment such as availability of resources and competition by others.”
I thought I saw where she was leading. “You’re implying that one or all of those things has significantly changed over the past three months.”
“What can be inferred about them, yes.”
“Could you have been misled by the loss of data when the servers crashed?” If so, then the initial projections were more trustworthy than what came later.
“The loss of data is a problem, but the difference has been confirmed in analysis of observations and test results acquired after the crash.”
I suddenly thought of Maura and the work she did to predict initial conditions when the strategy is executed. She must have seen this coming, which explained her lack of surprise.
There was one other possibility I felt compelled to explore. “Did the new analysis uncover a flaw in the original analysis?”
Sally’s reply was delayed by several seconds, a sign of embarrassment that must have felt like an eternity to her. “There is a significant probability that the original analysis underestimated the effect of declining resources on both population and the distribution of quality of life.”
I imagined the Hope Chart with the supply of resources being maintained by the effects of our reduction in population and consumption over the next twenty years. When we stop and level off, then the supply will drop to some level that other species can maintain above what we’re using. During that drop there should be no effect on us; but if I understood Sally correctly, there will be an effect that depends both on the remaining resources and how much people value needs and wants. The new data must have indicated that wants will be valued more than needs, resulting in fewer people at the end.
Sally agreed with this assessment when I shared it with her. “The alternative would be for a majority of people to live in perpetual collapse and high wealth inequality, similar to the present situation but with the average person barely meeting the basic needs of survival. They would much rather risk dying so they can be part of a smaller population living much better than that.”
Reality Check
Sally’s explanation for the population difference is fictional cover for an actual flaw I found in January’s simulation prior to writing this post. The description of the relationships and behaviors of the underlying variables is consistent with the current simulation and my interpretation of what it means.


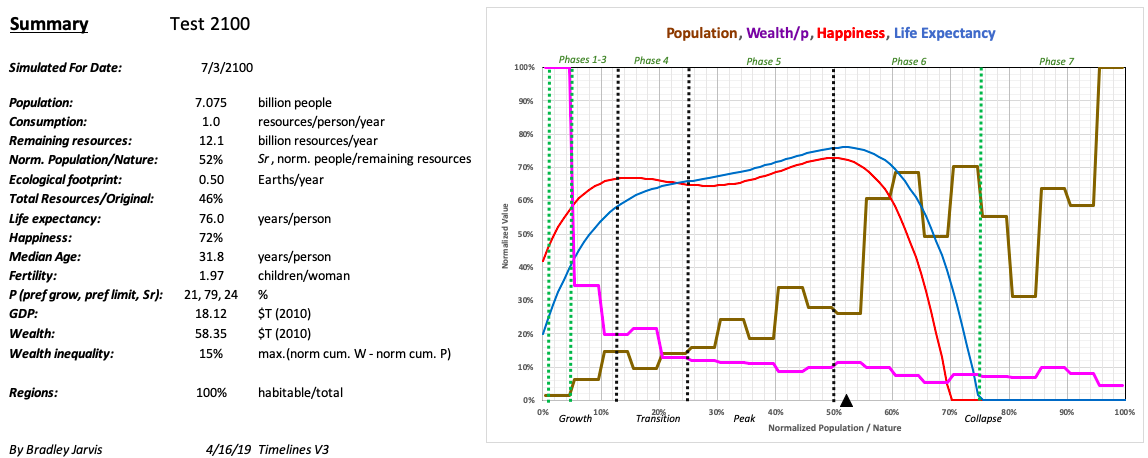
Simulation with low population, high consumption:


High population, low consumption:

No comments:
Post a Comment